Tor Snowflake Behavioral Analysis December 2021
@ # # @ # # # # @ ##### ### @ ##### ### @ ##### ### @ ##### ### @ ###### ### @ ###### ### @ ###### ### @ ###### ### @ ###### ### @ # ## ###### ### @############################################################### september 2021 december 2021
In my snowflake proxy output file I saw an increase in activity, not only there but also in the resource consumption of the entire operating system.
# filter results with traffic data:

less nohup.out | grep --color=always "Traffic throughput"

# send the obtained data to a file:

less nohup.out | grep --color=always "Traffic throughput" > trafico.txt
This gave me the data on active connections and their days-hours, but also a lot of other data like the amount of kbs transferred, but I only wanted to know the number of connections per day and their increase during my sample time of 107 days.
# get only the first two columns::

cut -d: -f '1 2' trafico.txt

# send those two columns to a file:

cut -d: -f '1 2' trafico.txt >> filtrado.txt

## put a comma after the first column of my data:

sed 's/ /, /g' filtrado.txt >> filtradoconcomas.txt
Now with data separated by commas you can graph them, but I’m a newbie in those concepts so I use this web version that uses D3.js
https://github.com/densitydesign/raw
With the data I obtained these graphs:
https://cacu.tech/snowflake/snowflakeconleche.png
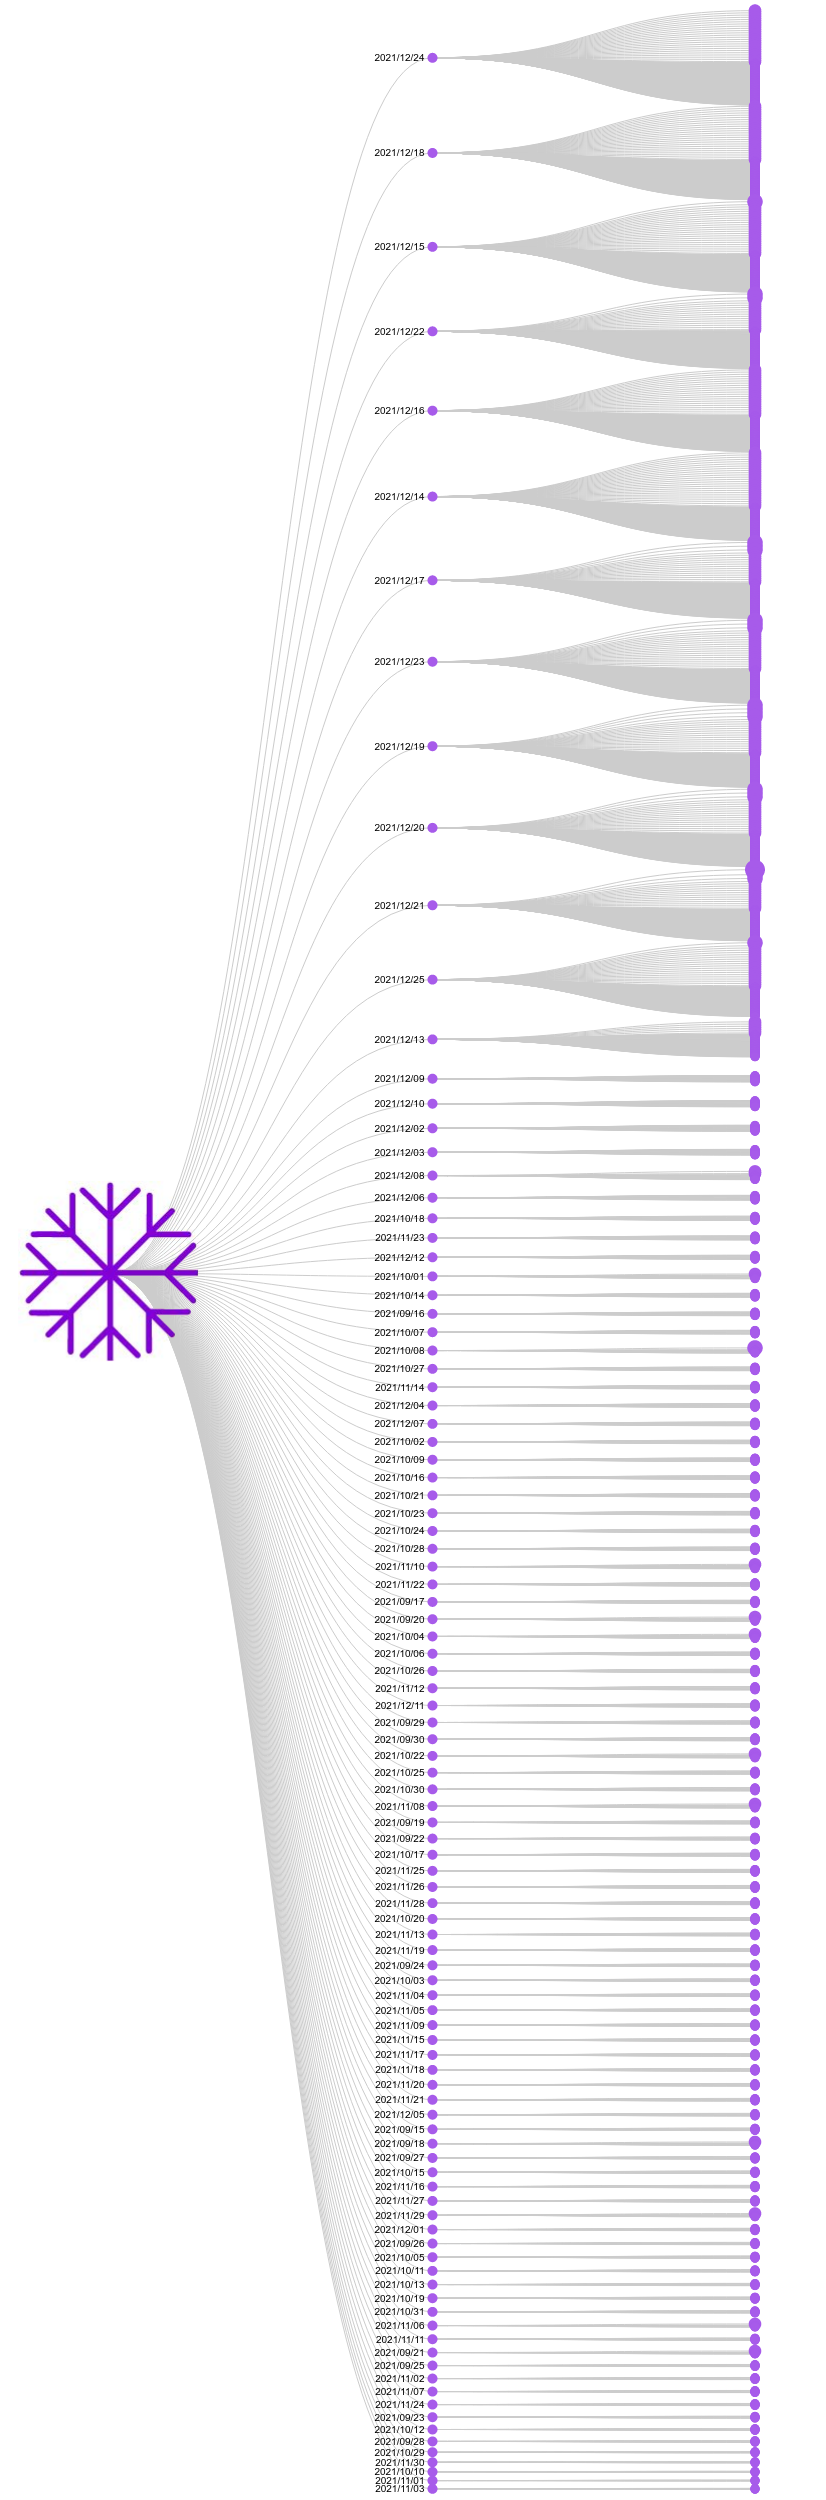
https://cacu.tech/snowflake/aumento.png
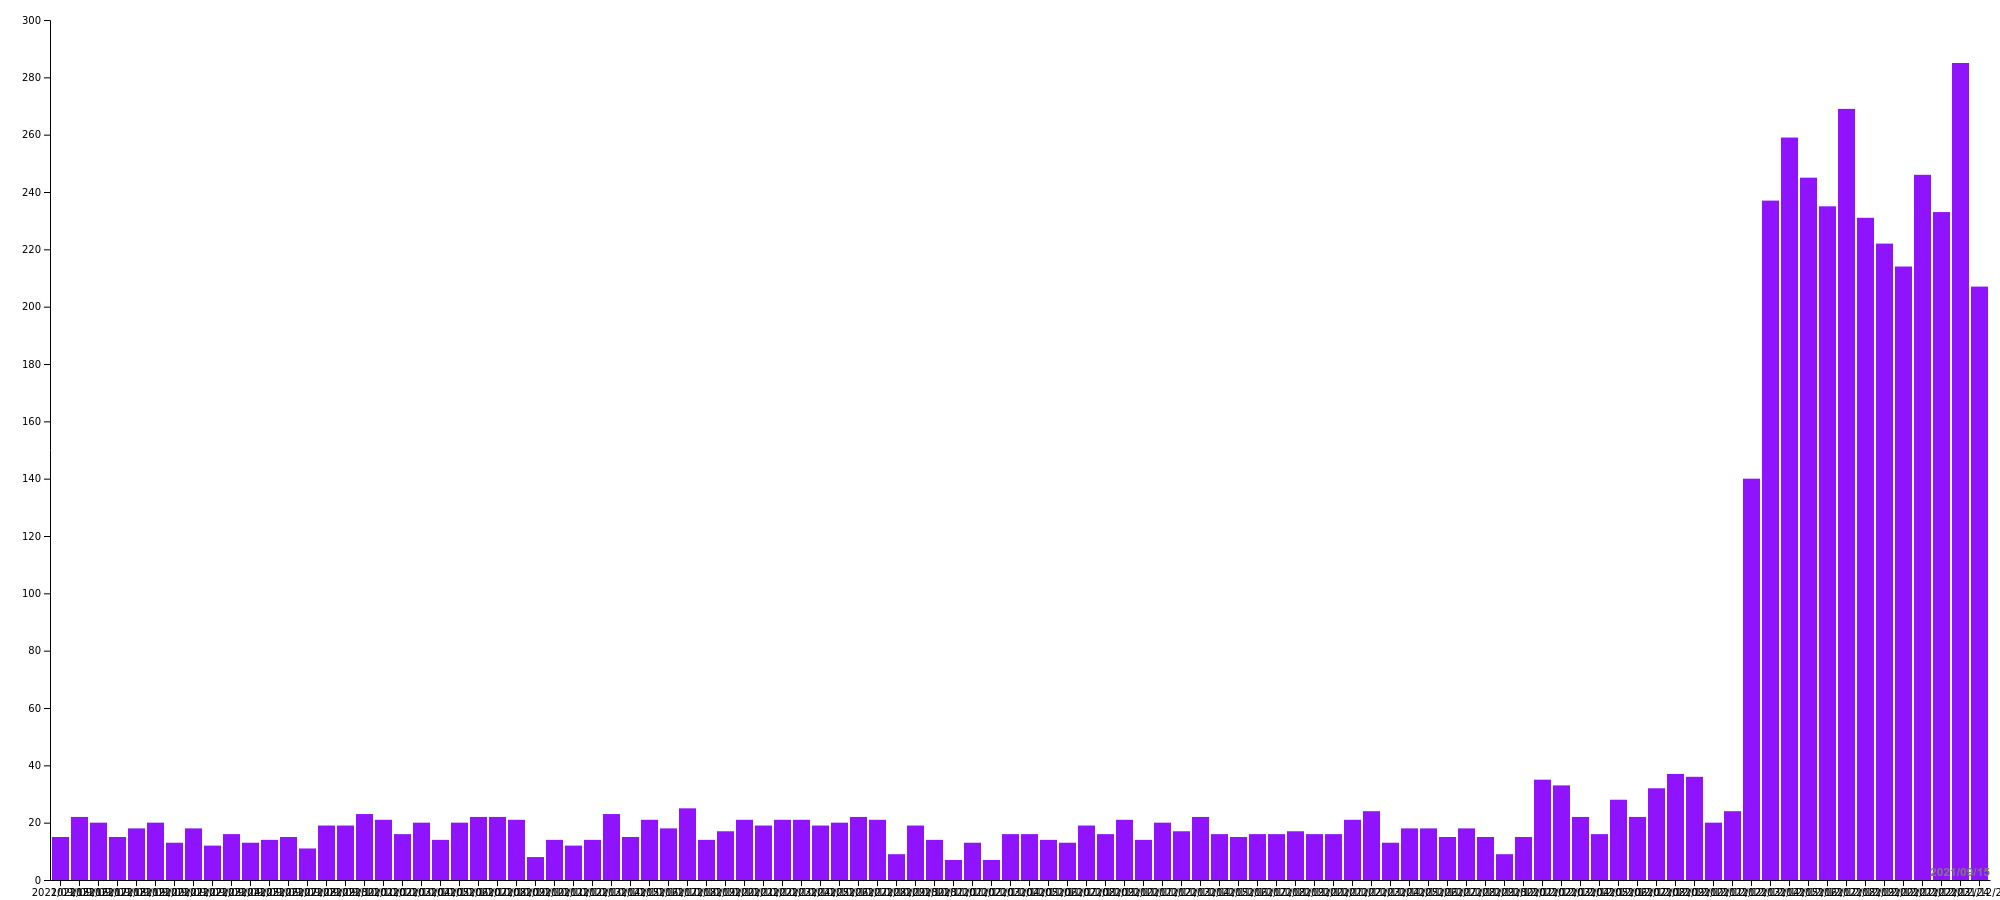
showing the increase from an average of 20 requests per day to 280.